

Compatible with embedded system setups using C/C++
Trusted by engineers from industry to public research
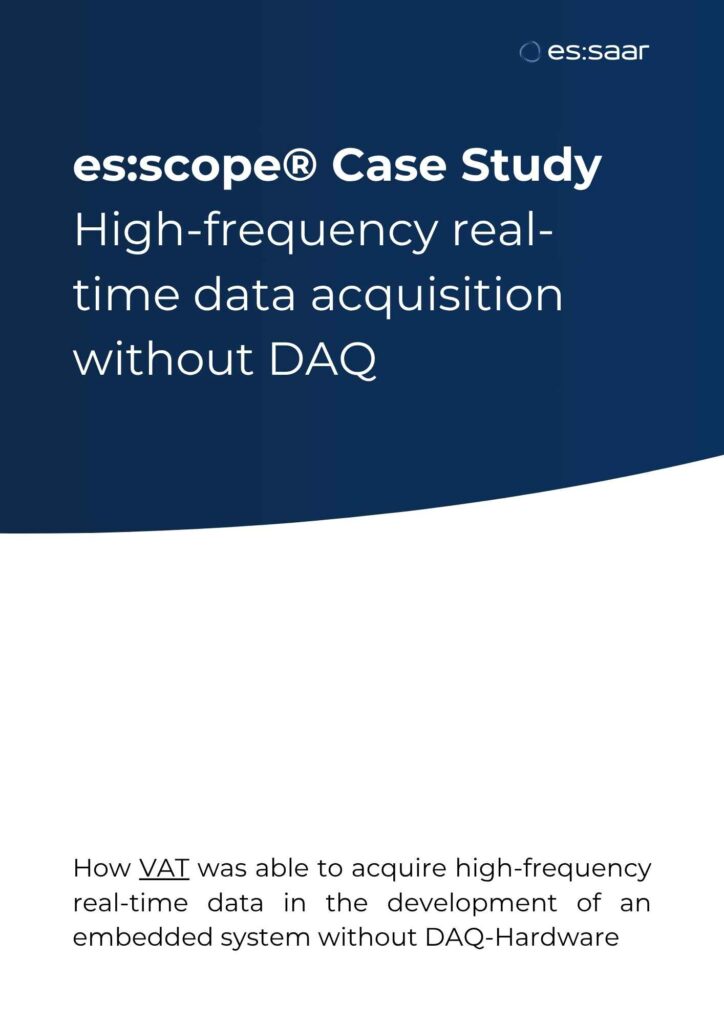
VAT Vakuumventile
Wellgo Systems GmbH
Chair of actuation technology UDS
Used for controller tuning, sensor validation and more. Read the case study here.
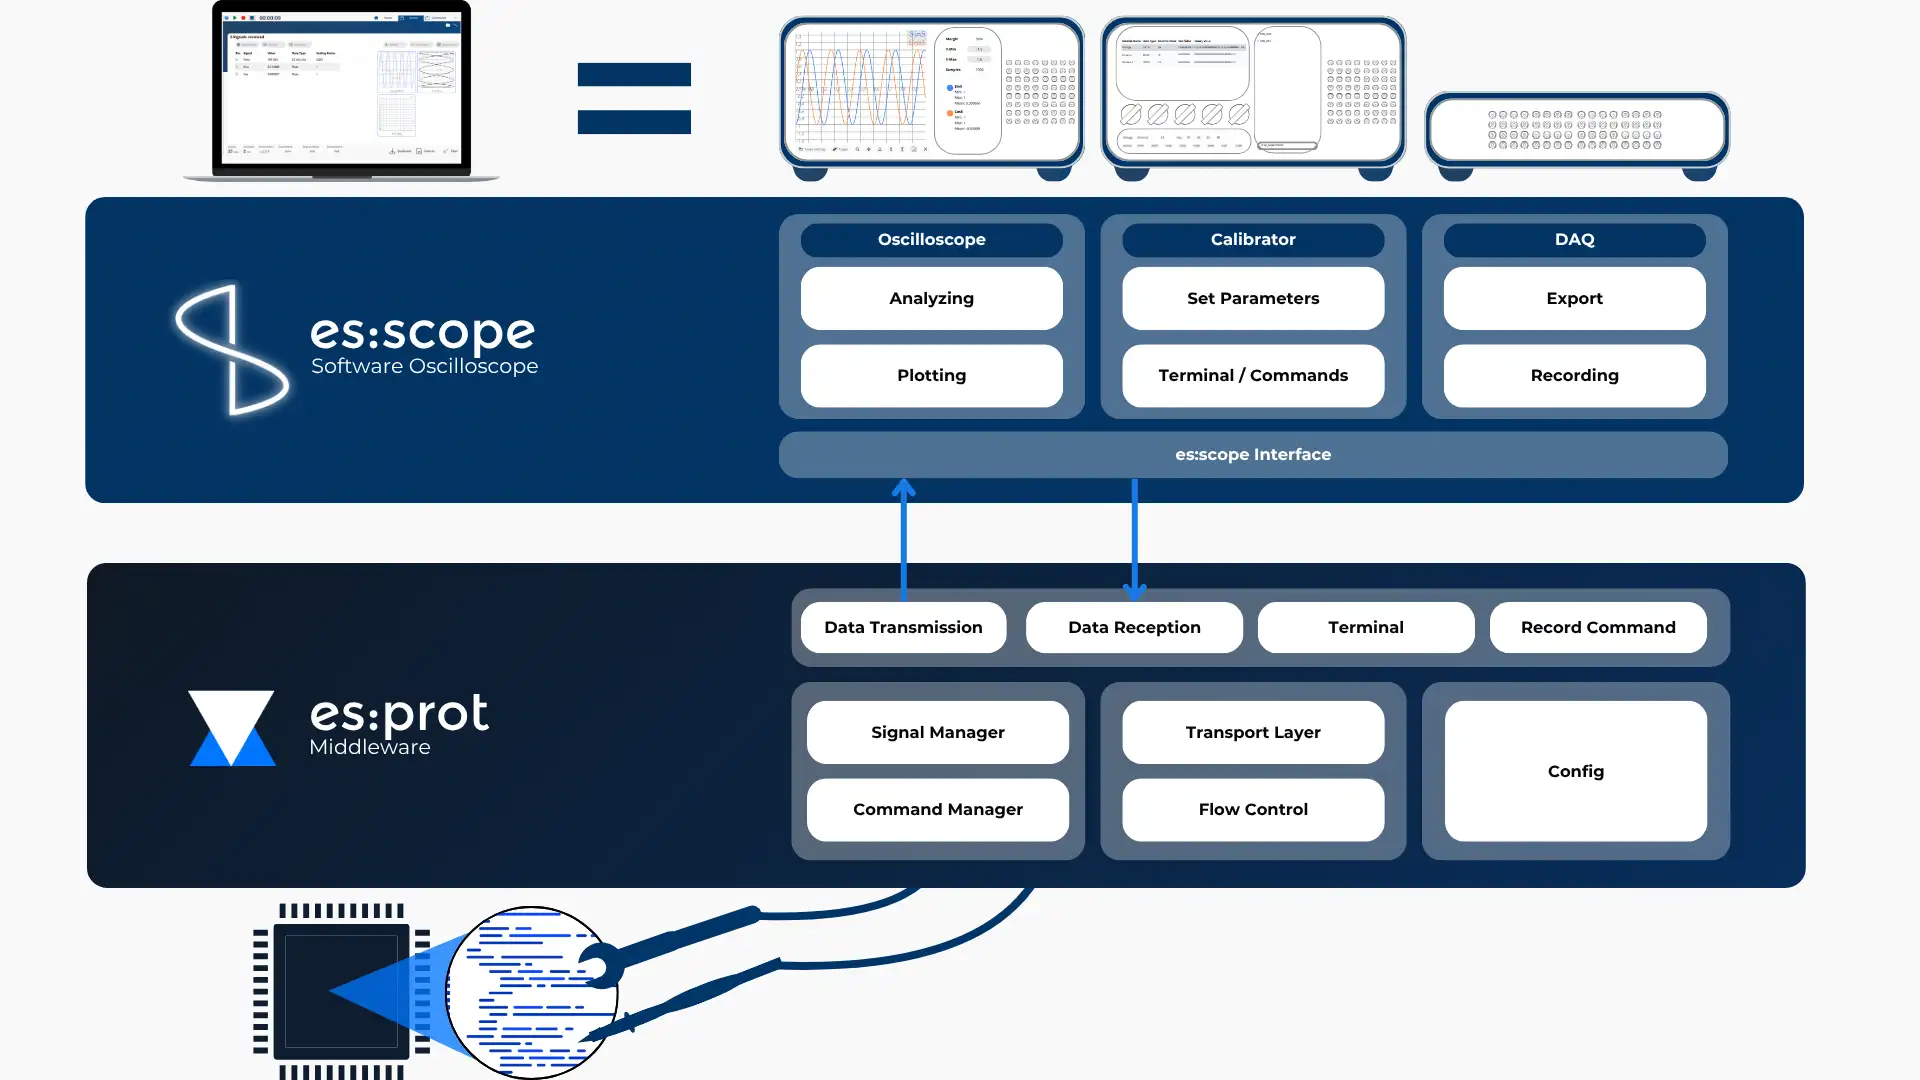
The es:scope® platform is designed for testing, measuring, and adjusting the runtime variable behavior of embedded systems. It incorporates the functionality of oscilloscopes, data acquisition devices, and calibrators.
es:scope® is compatible with any existing embedded system setup. Simply integrate the open middleware into your C or C++ project, configure it, and establish the connection. No ELF provision or additional measurement equipment is necessary.
es:scope® is hardware- and interface-independent. Its open, C-based middleware integrates into existing systems with minimal overhead and impact on system performance. The signals are configured in code, enabling version control, reproducibility, and plug-and-play usage.
Access to up to 64 internal runtime variables is possible as high-speed, real-time measurement signals. The rate at which data can be transferred is limited only by the capabilities of the interface and controller. Thanks to hardware acceleration, these signals can be plotted using an oscilloscope-like interface.
Variables selected from the embedded system are transferred to es:scope®, where they are plotted in real time with high bandwidth in the time, frequency, or XY domain. Additional information is provided by signal statistics, such as the average signal value. Similar to a traditional oscilloscope, signal triggers, cursor measurements, adjustable time windows, and various display parameters are possible.
You can start or stop a recording of signals manually via a computer or automatically via the embedded system. This enables developers to implement automated testing procedures and detect and record specific events and anomalies.
You can adjust parameters using asynchronous commands during runtime. This allows for calibration with immediate visual feedback. Additionally, developers can send user-defined commands to an embedded system’s terminal array to alter its behavior or operating mode.
es:prot™ is a lightweight, open-source C middleware that runs directly on embedded systems. It establishes a measurement oriented connection between firmware and es:scope®, enabling real-time access to internal variables and parameter tuning during runtime.
The middleware configures „virtual probes“ for any variable and manages commands, signals, and data flow independent of hardware or communication interface.
es:scope® is a registered trademark of es:saar GmbH. All Rights reserved.